Wednesday, November 30, 2011

OT: Recharging a defective Craftsman 19.2 battery

Several years ago, I received a Craftsman 19.2v cordless drill set as a gift. It came with 2 batteries and, over the years, the drill and the batteries have served me quite well. About a year ago after a particularly harsh winter, I tried to charge the batteries but the charger showed them as defective. Turns out that if the battery goes completely dead, the charger believes that it is defective and will not charge them.

Thanks to the power of the Internet, I was able to "jump start" my dead batteries to where the charger would not see them as defective and charge them. I should note that the idea was not my own but came from the user FongBar via this post.

Since I believed that both of my batteries were beyond repair, I had already purchased a new battery that was fully functional. Having a fully functional and charged battery is important because this is how we will "jump start" the old battery.

To start, I went to Harbor Freight and bought these CEN-TECH 18" Low Voltage Multi-Colored Test Leads.These will be used to transfer the charge from one battery to the other.


Once you have the leads, the charged battery, and the defective battery, you are ready to hook up the two to start transferring the charge.

When you set both batteries down, you will see the terminals are setup in a cross shape. The two batteries will be connected in parallel, meaning that using the leads, you will connect the top terminal on the good battery to the top terminal on the bad battery. The same goes for the left, right and bottom terminals.


Once the batteries are hooked together, let them sit from 20 - 30 minutes. Once the time has passed, I put the old, defective battery on the charger and it started charging again. This procedure only has to be done once and your battery should charge normally from this point forward.

Disclaimer: This tutorial is without guarantee and all liability rest solely with the reader.

Wednesday, November 16, 2011

Resource Governor - A Practical Example

If your running SQL Server 2008 Enterprise and have the need to restrict certain users or groups from executing runaway queries, then the Resource Governor might be what you are looking for. By creating the right mix of workload groups and resource pools, a DBA can create an environment that is more predictable and stable, while maintaining the availability of resources for all users.

In this example, I'll create a Workload Group that only Windows logins will use. I used the distinction of Windows logins vs SQL logins because all the produciton applications hitting this server use SQL authentication while any users (aside from the sys admins) doing ad hoc analytics use Windows authentication. Many times when users are doing ad hoc analytics, they are digging through the data and looking for trends, which lends itself to someone using "Select *".  That kind of query on very wide and deep tables can easily lock a table needed for the production applications. This is where the resource governor can help. By limiting the amount of resources a query or a session can have, a DBA can make other sessions on the server execute more predicitbly.

There is quite a bit of setup involved with the Resource Governor and there are many different ways to do it, so that steps I take below will obviously have to be tailored to your enviornment.

There are 3 main parts to setting up the Resource Governor:
   1.       Resource Pool: A pool of resources that Workload Groups will access.
   2.       Workload Group: Group that logins belong to based on the Classifier Function.
   3.       Classifier Function: Function that assigns logins to Workload Groups.

First , let's do the setup for the classifier. Since we are classififing on login type (SQL or Windows) our Classifier Function should be quite simple, but the Classifier Function has to be schema bound, which means we can't reference sys.server_principals. So since we can't use the system tables in the Classifier Function, we need to create our own table in the MASTER database to keep SQL login information.

CREATE TABLE [SQLLoginsList]
(SQL_LoginName sysname)

Now we need to populate the table with all the existing SQL Logins.

Insert Into SQLLoginsList
Select Name From sys.Server_Principals Where [Type] = N'S'

Once the table is in place, a server trigger needs to be created to insert into the SQLLoginsList table any time a new SQL Login is created.

SET ANSI_NULLS ON
GO
SET QUOTED_IDENTIFIER ON
GO

CREATE TRIGGER [srv_trg_SQLLoginList] ON ALL SERVER
       WITH EXECUTE AS 'sa'
       FOR CREATE_LOGIN
AS
       SET NOCOUNT ON
       SET CONCAT_NULL_YIELDS_NULL ON
       SET ANSI_PADDING ON
       SET ANSI_WARNINGS ON

       IF (SELECT   EVENTDATA().value('(//LoginType)[1]', 'VARCHAR(255)')) = 'SQL Login'
          BEGIN
                IF NOT EXISTS ( SELECT  *
                                FROM    SQLLoginsList
                                WHERE   SQL_LoginName = EVENTDATA().value('(//ObjectName)[1]','VARCHAR(255)') )
                   BEGIN
                         INSERT dbo.SQLLoginsList(SQL_LoginName)
                         SELECT  EVENTDATA().value('(//ObjectName)[1]','VARCHAR(255)')
                   END  
          END
GO

SET ANSI_NULLS OFF
GO
SET QUOTED_IDENTIFIER OFF
GO

ENABLE TRIGGER [srv_trg_SQLLoginList] ON ALL SERVER
GO

Now that we have a place to query SQL Logins and a mechanism to catch newly created ones, we can start creating our Resource Pool and Workload Group.

When creating a Resource Pool, there are 4 properties that can be set.
   1.       MIN_CPU_PERCENT: The minimum CPU bandwidth for the pool when there is CPU contention.
   2.       MAX_CPU_PERCENT: The max CPU bandwidth for the pool when there is CPU contention.
   3.       MIN_MEMORY_PERCENT: minimum amount of memory reserved for this pool.
   4.       MAX_MEMORY_PERCENT: maximum amount of memory requests in this pool can consume.

The "when there is CPU contention" because CPU contention is a soft limit, meaning when there is no CPU contention the pool will consume as much CPU as it needs.

CREATE RESOURCE POOL pAdhocProcessing
WITH
 (MIN_CPU_PERCENT = 0 --no min cpu bandwidth for pool WHEN THERE IS CONTENTION
 ,MAX_CPU_PERCENT = 25 --max cpu bandwidth for the pool WHEN THERE IS CONTENTION
 ,MIN_MEMORY_PERCENT = 0 --no memory reservation for this pool
 ,MAX_MEMORY_PERCENT = 25 --max server memory this pool can take
 )

Next comes the creation of the Workload Group. By default there is already a group called "default" that all users are placed into if they aren't placed into another Workload Group by the Classifier Function. Think of the Workload Groups as buckets of users that can dip water (resources) from an assigned "pool" (Resource Pool). Each Workload Group can only have one Resource Pool, but a Resouce Pool can have many Workload Groups assigned to it.

When creating a Workload Group, there are 6 properties that can be set.
   1.       IMPORTANCE: Gives a precedence or "importance" to CPU resources available in the Resource Pool.
   2.       REQUEST_MAX_MEMORY_GRNT_PERCENT: Amount of memory one request can take from Resource Pool.
   3.       REQUEST_MAX_CPU_TIME_SEC: Amount of total CPU time a request can have.
   4.       REQUEST_MEMORY_GRANT_TIMEOUT_SEC: Maximum amount of time a request will wait for resource to free up.
   5.       MAX_DOP: Max Degree of Parallelism a query can execute with. This option takes precedence over any query hint or server setting.
   6.       GROUP_MAX_REQUESTS: Amount of requests this group can simultaneously issue.

The following script will create the Workload Group and assign it to a Resource Pool

CREATE WORKLOAD GROUP gAdhocProcessing
WITH
  (IMPORTANCE = LOW --Low importance meaning the scheduler will execute medium (default) session 3 times more often
  ,REQUEST_MAX_MEMORY_GRANT_PERCENT = 25 --one person can only take 25 percent of the memory afforded to the pool
  ,REQUEST_MAX_CPU_TIME_SEC = 60 --can only take a TOTAL of 60 seconds of CPU time (this is not total query time)
  ,REQUEST_MEMORY_GRANT_TIMEOUT_SEC = 60 --max amount of time a query will wait for resource to become available
  ,MAX_DOP = 1 --overrides all other DOP hints and server settings
  ,GROUP_MAX_REQUESTS = 0 --unlimited requests (default) in this group
  )
 Using pAdhocProcessing

At this point, we should see the following under Management --> Resource Governor


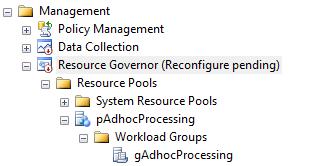
The Resource Governor will stay in "Reconfigure Pending" status until we create the Classifier Function and issue a Reconfigure Command to turn the Resource Governor on.

Finally, we'll create our Classifier Function that will place all incoming requests into either the gAdhocProcessing group or the default group. This function looks a lot like any other scalar function with the excepting that is had to be created using "With SchemaBinding". Based on the login type and whether the login is a sysadmin, the function will return what Resource Group the request should fall into.

CREATE FUNCTION fnLoginClassifier()
RETURNS sysname
WITH SCHEMABINDING
as
Begin
  Declare @Login sysname

  set @Login = SUser_Name()

  if (IS_SRVROLEMEMBER('sysadmin') = 1)  --Server Admins
    Return N'default'
  else if (Select Count(*) from dbo.[SQLLoginsList] Where SQL_LoginName = @Login) > 0 --SQL Logins
    Return N'default'
  else if @Login like '<domain>%' --Windows Logins
    Return N'gAdhocProcessing'

  --If nothing is returned, put it in the default group just in case
  Return N'default'
End
GO   

Now that the Classifier Function has been created we have to tell the Resource Governor to use that function as it's classifier.

ALTER RESOURCE GOVERNOR with (CLASSIFIER_FUNCTION = dbo.fnLoginClassifier)

At this point, if we right click the  Resource Governor in the Object Explorer and choose properties we will should see the following.


The Resource Pool pAdhocProcessing has been created and the Workload Group gAdhocProcessing has been assigned to it. Also, the fnLoginClassifier function shows as the Classifier function name and the message at the top signals us that the Resource Governor has pending changes and that we need to issue a Reconfigure command to enable the governor.

Now all that's left to do is turn it on. We can do that by issuing the following command.

ALTER RESOURCE GOVERNOR RECONFIGURE

Once the Resource Governor is turned on, we can monitor the amount of sessions each login has open and what Workload Group they have been assigned to.

SELECT  WG.name
       ,COUNT(*)
       ,ES.login_name
       ,es.program_name
FROM    sys.dm_exec_sessions ES
        INNER JOIN sys.dm_resource_governor_workload_groups WG
        ON ES.group_id = WG.group_id
GROUP BY WG.name,es.login_name,es.program_name       
ORDER BY login_name 

If for some reason the Resource Governor is not working as it should, issue the following command to disable it.

ALTER RESOURCE GOVERNOR DISABLE

Since it is possible on a busy system to lock yourself out by configuring the Resource Governor incorrectly, you may have to sign in with the Dedicated Administrator Connection (DAC). That connection uses the internal Workload Group and cannot have it's resources altered. Once you have established a connection using the DAC, you will have the ability to either disable the Resouce Governor or remove the Classifier Function. If you remove the Classifier Function, all incoming connections will fall to the default group. To remove the Classifier Function, issue the following commands.

ALTER RESOURCE GOVERNOR with (CLASSIFIER_FUNCTION = NULL)
ALTER RESOURCE GOVERNOR RECONFIGURE

Thursday, October 13, 2011

Remove an Article from Transactional Replication without dropping the Subscription

          While using Transactional Replication, there may come a time when you need to drop an article from a publication, a publication that may have one or more subscriptions. You would think that the process would be very similar to adding an article to the publication; open up the article and uncheck the box. Now, if there were no subscribers to the publication, this would not be an issue, but odds are that this publication has been used for some time and there are one or more subscribers to it. If this is the case, when you go to uncheck the article to remove it, you may receive an message stating that since there are subscriptions on this table, you will have to reinitialize this subscription and generate a new snapshot.

          So how can we get around re-initialization of the subscriber and new snapshot generation? We manually execute some of the replication stored procedures to remove the article and keep the snapshot from being invalidated.

First we must use
sp_dropsubscription to remove the subscription to the individual article.

EXEC sys.sp_dropsubscription
    @publication = '<PublicationName>',
    @article = '<ArticleToDrop>',
    @subscriber = '<SubscribingServer>',
    @destination_db = '<DestinationDatabase>'
 
Next, we drop the article from the publication without invalidating the snapshot. We do that by executing sp_droparticle with the force_invalidate_snapshot set to 0.

EXEC sys.sp_droparticle @publication = '<PublicationName>',
    @article = '<ArticleToDrop>',
    @force_invalidate_snapshot = 0

Wednesday, September 21, 2011

Does A Log Backup Failure Break The Chain?

We recently ran into a situation where the file share we were using to store full database backups along with transaction log backups ran out of space.  When the transaction log tried to backup we received the following error:

SQL Server Alert System: 'Severity 016' occurred on <Server>

DESCRIPTION:    BackupIoRequest::ReportIoError: write failure on backup device '<filepath>\<filename>.trn'. Operating system error 112 (There is not enough space on the disk.).

Our first thought was that since the transaction log backup failed, our backup chain was broken. So once we cleared space on the file share, we ran a full backup on each of the affected databases.

After some research regarding transaction log LSN's and the Backupset table in the MSDB database, I quickly relearned that the chain had never been broken. Since the Tlog backup failed to complete successfully, no record was written in the Backupset table and the inactive portion of the log was never truncated. You can verify this by looking at the First_LSN and the Last_LSN column in the MSDB..BackupSet table using the following query.

SELECT  backup_start_date
            ,type
            ,first_lsn
            ,last_lsn
            ,checkpoint_lsn
            ,database_backup_lsn
  FROM  msdb..backupset
WHERE   database_name = '<DBName>'   
       and type = 'L'  
ORDER BY backup_start_date


In order for the chain to be unbroken, the First_LSN must equal the previous Tlog backup's Last_LSN. In this scenario, log backups are taken once an hour and failed starting at 11 PM until space was cleared on the file share and the next Tlog backup ran at 6 AM. Once space was cleared, the transaction log backup could finally complete and the inactive portion of the log could be truncated.  We can verify this by looking at the Last_LSN on the 10 PM Tlog backup and correlating that to the First_LSN on the next day's 6 AM Tlog backup.

So even though the space error occurred and the Tlog backup failed, the transactions in the log were preserved until such time that a successful transaction log backup could be completed.

Monday, September 19, 2011

Monitor Backup and Restore Progress Using DMV's

When using SQL Agent jobs or a third party tool to control database backups on a scheduled basis, you may lose the ability to monitor the progress of the backup job. 

For instance, if we executed the following BACKUP command in a T-SQL window, we have the ability to monitor its progress in the messages window.

BACKUP DATABASE <DBName> TO DISK = N'<File>'
WITH
NOFORMAT,NOINIT,
NAME = N'<Name>',
SKIP,NOREWIND,NOUNLOAD,
STATS = 10
 GO

But when jobs are executed via the SQL Agent, that information is abstracted away from us since it is happening in the background. Luckily, there are a couple Dynamic Management Views (DMV) that can tell us the BACKUP commands progress as well as the exact command issued.

By executing the following query, we can get an idea of how far along our backup, restore or rollback operation has progressed. Unfortunately, this will not work for queries.

 SELECT er.percent_complete
                ,db_name(er.database_id) AS [DB]
                ,st.text
                ,er.command
 FROM sys.dm_exec_requests er
         CROSS APPLY sys.dm_exec_sql_text(er.sql_handle) st
 WHERE percent_complete <> 0

Tuesday, September 13, 2011

Help! My Query Is Running Slow! How Execution Plans Can Save The Day.

Have you ever said this or has a developer ever come running to you in a panic saying what happened? How many times have you heard: “We just promoted this small report change and now it’s taking twice as long to run”? Probably more times than you would like to admit. When this happens, where do you start looking for issues? The answer can likely be found in Execution Plans.
Execution Plans can be very useful in debugging why a query is running slowly and can give insight into what SQL Server is doing behind the scenes to return the data.  Depending on the complexity of the query, Execution Plans will show where the data is being pulled from, how much data is being pulled, what manipulations are being performed, and what the cost is for each of those operations. There are many more things that a complex Execution Plan can, and will, show; but for simple, one table queries like the ones below, the Execution Plan is pretty straight forward.

To start, we’ll create a small employee table like so:

CREATE TABLE Employees
       (
        EmployeeID INT IDENTITY(1, 1)
        ,FirstName VARCHAR(50)
       ,MiddleInitial CHAR(1)
       ,LastName VARCHAR(50)
       ,Address1 VARCHAR(50)
       ,Address2 VARCHAR(50)
       ,City VARCHAR(50)
       ,[State] CHAR(2)
       ,Zip CHAR(10)
       ,CONSTRAINT PK_Employees PRIMARY KEY CLUSTERED (EmployeeID) WITH FILLFACTOR = 100)
And add a small nonclustered index like so:
CREATE NONCLUSTERED INDEX NCL_Emp_FName_LName ON Employees(FirstName, LastName) WITH FILLFACTOR = 100
Next, I populated the table with about 500,000 employees, each with unique values. Now, entering in 500,000 employee records isn't really feasible, so I used Red Gate’s SQL Data Generator. After the data has been loaded, we can start looking at Execution Plans.
This exercise assumes that we will be using SQL Server Management Studio (SSMS) to generate and review Execution Plans and that all the statistics on the table are up to date. There are several ways to extract and view Execution Plans, but we will stick with the simpliest which is viewing the actual Execution Plan in SSMS after the query executes. This can be acomplished by keying CTRL+M in the query window. Now, after the query executes, the actual Execution Plan will be shown beside the messages tab.
Now that we have SSMS setup to show the Execution Plan, we can run our query that was running well prior to the modification.
SELECT  FirstName
       ,LastName
FROM    Employees
WHERE   LastName = 'Whitehead'
        AND FirstName = 'Aisha'
This query returned 3 rows and generated a nice Index Seek on the nonclustered index that we defined on the FirstName and LastName column.


Now, let’s say that a developer gets a request to return FirstName, LastNane, and MiddleInitial. Using the following query, we can return that information.
SELECT  FirstName
       ,LastName
       ,MiddleInitial   
FROM    Employees
WHERE   LastName = 'Whitehead'
        AND FirstName = 'Aisha'

The problem is now, what once was a sub-second query is now taking much longer. Why? All the developer did is was add 1 column to the query. The answer is in the Execution Plan.


What we see now is two added steps, a Key Lookup and Nested Loop Join. In this instance, the Key Lookup is the operator that is causing the issue and you can see this by looking at the actual cost listed under the operator, which is 52% of the entire query. This is because the nonclustered index that we created at the beginning of the project has most, but not all, of the columns the modified query is looking for. In order the satisfy the request, the query processor must go outside the index and back to the clustered index in order to find MiddleInitial and return it as a part of the query. As you can see, this is an expensive operation and one that could be averted if only the nonclustered index included the MiddleInitial column.

For this exercise, we will add the MiddleInitial to the index as a part of the composite index rather than adding it as an Included Column in the index.

IF  EXISTS (SELECT * FROM sys.indexes WHERE object_id = OBJECT_ID(N'[dbo].[Employees]') AND name = N'NCL_Emp_FName_LName')
DROP INDEX [NCL_Emp_FName_LName] ON [dbo].[Employees]
GO

CREATE NONCLUSTERED INDEX [NCL_Emp_FName_LName] ON [dbo].[Employees]
(
      [FirstName] ASC,
      [LastName] ASC,
      [MiddleInitial] ASC
)WITH (FILLFACTOR = 100) ON [PRIMARY]
GO

Now when we go back and run our modified query, we will see the following Execution Plan.


And our query is back to running like it was before… fast.

Wednesday, August 31, 2011

How to execute SQLCMD from SSIS

If you have ever needed to execute SQLCMD from an SSIS package, you can use the Execute SQL Task component along with xp_cmdshell to do the job.

I used the following script inside the Execute SQL Task component to make it work:

DECLARE @Server SYSNAME
DECLARE @SQL NVARCHAR(500)
SET @Server = @@SERVERNAME

SET @SQL = 'EXEC xp_cmdshell ''SQLCMD -S ' + @Server + ' -d <DBNAME> -q "<SomeProc>"'

EXEC sp_executesql @sql

Tuesday, August 23, 2011

Dynamic SQL vs. Stored Procedures

     So much has been written about the pros and cons of Dynamic SQL vs. Stored Procedures, with a lot of venom coming from both sides. As a DBA, I really push hard for the use of Stored Procedures as the only way to access or manipulate data, but as an ex-developer, I see the allure of Dynamic SQL.

     The purpose of this post is not add to yet another article to the "flame ridden" posts already out there, but to get a sense of where people stand and what people are using in their shops. Please reply to this post with which side you come down on, your job title (if applicable), and either an existing article or brief summary that best describes why you feel the way you do.

Thursday, August 18, 2011

LINQ to SQL and Entity Framework vs. Stored Procedures

An interesting presentation by SQL MVP Bob Beauchemin outlining the pros and cons of LINQ to SQL and Entity Framework vs. Stored Procedures.

Finding Stored Procedures Related to Replication

If you have transactional or merge replication configured in your environment, you may want to know what objects were create by replication in your subscribing database. For Stored Procedures, there’s nothing in the sys.objects or sys.procedures catalog views that denotes that a procedure is used with replication. Fortunately, there is a system table created in the subscribing database called MSreplication_objects. The query below will give you the Stored Procedures created by replication and the articles associated with them.

SELECT [publisher]
      ,[publisher_db]
      ,[publication]
      ,[object_name]
      ,[object_type]
      ,[article]
  FROM [MSreplication_objects]
 WHERE [object_type] = 'P'

Now that we know the procs that are related to replication, we can exclude them from sys.objects or sys.procedures when looking for user procs in the database.
SELECT *
 FROM   sys.procedures
 WHERE  name NOT IN (SELECT [object_name]
                     FROM   MSreplication_objects
                     WHERE  [object_type] = 'P')

Wednesday, August 17, 2011

Backing Up an Analysis Services Database

There are a lot of DBA’s out there who have to administer SQL Analysis Services, but haven’t the slightest clue on how to do anything more than set it up and grant security. After the database has been setup and cubes are being created, it will need to be backed up just like the SQL databases you are already familiar with. So how do you backup an Analysis Services database when you can’t use the T-SQL commands you know and love? The answer is Analysis Services commands.

Start by opening up a new Analysis Services XMLA Query and log into the Analysis Services instance. You can do this by selecting File -> New -> Analysis Services XMLA Query
It will open up what looks to be a T-SQL window but it will only accept XML commands against the Analysis Services database. The following query will back up a single Analysis Services database without encryption or compression.

<Backup xmlns="http://schemas.microsoft.com/analysisservices/2003/engine">
  <Object>
    <DatabaseID>Insert SSAS Database name here</DatabaseID>
  </Object>
  <File>file_location\file_name.abf</File>
  <AllowOverwrite>true</AllowOverwrite>
</Backup>

Insert your own values into the <DatabaseID >, <File>,<AllowOverwrite> fields and run the command. Once you have it working, you can schedule it in a SQL Agent Job just like any other backup job that you may have out there. In the job step, select a type of “SQL Server Analysis Services Command”
A more in-depth reference be found here: http://msdn.microsoft.com/en-us/library/cc917611.aspx#XSLTsection124121120120

Tuesday, August 16, 2011

WHAT SQL TABLES AND INDEXES ARE TAKING UP SPACE IN MEMORY?


Ever have a SQL Server run low on memory? Unless you’re buying “big iron” for every server or never consolidate SQL instances, chances are you have. Ever wonder “What’s taking up all the memory?”, Probably. Luckily, with DMV’s introduced in SQL 2005, we can get a snapshot of the tables and indexes that are occupying memory inside the SQL Buffer Pool.

As we all know, indexes are a blessing for reading data from SQL, but not much thought is given to overhead associated with indexes. Not only is there more work to be done when an insert, update or delete on the base table (or clustered index), the newly created index will also start residing in memory as it is used in queries. Also, an index can become less useful over time as the columns in the index become less unique; resulting in index scans rather than index seeks. While this may cause query performance to suffer; in the context in memory, this causes more 8KB index pages to be read into memory, consequently bloating your Buffer Pool.

To view the tables and indexes that are taking up residence in you SQL Server memory, the following query can be ran from the master database. The query makes use of the sp_msforeachdb stored procedure to get the names of the objects in memory from each database . Below are some notes on the result set returned by the query:

·         This query will only return tables and indexes in memory from User databases. Master, Tempdb, MSDB, and Model are omitted.

·         Indexes with an ID of 1 are the clustered index for the table. Indexes with an ID of 0 are tables that do not have a clustered index and are referred to as Heaps. All others are non-clustered indexes.

·         Not only will you be able to see the size of each object in memory by megabytes, I’ve also included some usage statistics on those indexes. These statistics will give you an idea on how your index is being used and how effective it is.

·         Documentation on the system tables and DMV’s used in the query can be found below


·         This query does not return information on other objects in memory such as the ones that live in the Procedure Cache or those governed by the Lock Manager.
Query Below:

IF OBJECT_ID('tempdb..#Objects') IS NOT NULL
  DROP TABLE #Objects

 CREATE TABLE #Objects
    (
      ObjectName SYSNAME ,
      ObjectID INT ,
      IndexName SYSNAME ,
      IndexID INT ,
      BufferSize INT ,
      BufferCount INT ,
      DBName SYSNAME
    )
 GO

 EXEC sp_msforeachdb 'use ?;
 IF DB_ID(''?'') > 4
 insert into #Objects(ObjectName,
                      ObjectID,
                      IndexName,
                      IndexID,
                      BufferSize,
                      BufferCount,
                       DBName)
 SELECT OBJECT_NAME(P.Object_ID),
        P.Object_ID, 
        Coalesce(I.Name,''**Heap**''),   
        P.Index_ID,
        COUNT(*)/128, 
        COUNT(*),
        db_name()    
   FROM sys.allocation_units AS AU INNER JOIN sys.dm_os_buffer_descriptors AS OSB    
    ON AU.allocation_unit_id = OSB.allocation_unit_id    
                                     INNER JOIN sys.partitions AS P    
    ON AU.container_id = P.hobt_id 
                                    INNER JOIN sys.indexes AS I
    ON P.index_id = I.index_id
   AND P.object_id = I.object_id     
 WHERE OSB.database_id = DB_ID()    
 GROUP BY P.object_id, P.index_id,Coalesce(I.name,''**Heap**'')'
 GO

SELECT  #Objects.DBName ,
        #Objects.ObjectName AS TableName ,
        #Objects.IndexID,       
        #Objects.IndexName ,       
        #Objects.BufferSize ,
        #Objects.BufferCount ,
        IUS.user_seeks ,
        IUS.user_scans ,
        IUS.user_lookups ,
        IUS.user_updates ,
        IUS.last_user_seek ,
        IUS.last_user_scan ,
        IUS.last_user_lookup ,
        IUS.last_user_update ,
        IUS.system_seeks ,
        IUS.system_scans ,
        IUS.system_lookups ,
        IUS.system_updates ,
        IUS.last_system_seek ,
        IUS.last_system_lookup ,
        IUS.last_system_update ,
        IUS.last_system_scan
FROM    #Objects INNER JOIN sys.dm_db_index_usage_stats IUS
     ON #Objects.DBName = DB_NAME(IUS.database_id)
    AND #Objects.objectid = IUS.OBJECT_ID
    AND #Objects.indexid = IUS.index_id
ORDER BY 5 DESC

GO